

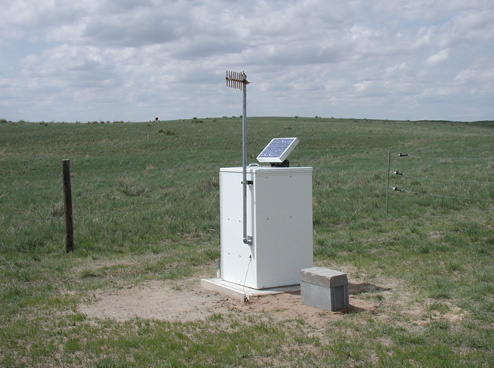
The Imperial site, a semi-arid rangeland area in the northern High Plains region, is an example of steady flow in a non-uniform profile. Mean annual precipitation is about 50 cm/y, with frequent wind and low humidity contributing to high evapotransipration rates. Matric potential profiles shown below were measured over a period of a few years with an accuracy of about +/-100 cm ( McMahon and others, 2006). In this case, matric potential profiles are unchanging in time, though small matric potential gradients exist within the profile. There may be steady flow within layers with gradients mainly driving flow between layers. Recharge rates were calculated from unsaturated hydraulic conductivity measured in the laboratory using the steady-state centrifuge method (SSCM). Depth to the water table, which is gradually decling due to water withdrawl, was about 28 m at the time of sampling.
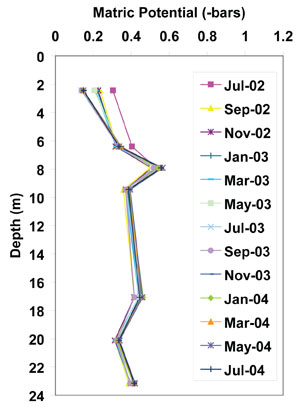
Minimally disturbed core samples were obtained using a casing-advance drilling method for measurement of field water content and unsaturated hydraulic properties. Each 15-cm-long aluminum-lined core section was capped, labeled, wrapped in plastic, and sealed in individual aluminum pouches immediately after being removed from the core barrel following the procedures of Hammermeister and others (1986) and Izbicki and others (2000) to protect the core from evaporation and contamination. Bulk sample were also taken at 1-ft intervals for measurement of particle size distributions in order to assess heterogeneity. Field matric potentials were collected over a period of several years using heat dissipation probes (graph below). Water contents were measured gravimetrically on cores as well as determined by paring HDP-dtermined matric potentials with lab-measured water retntion curves. The values agreed from within 0 to 10%.
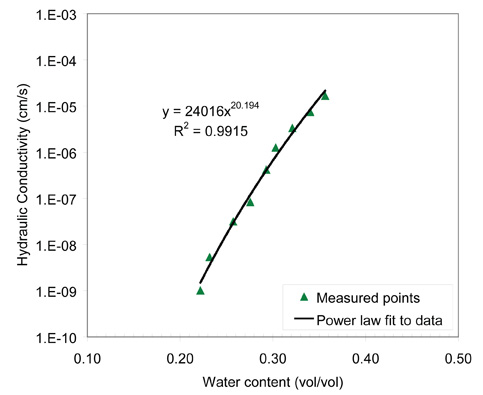
The unsaturated hydraulic conductivity points measured in the laboratory for one of five samples (the one closest to the water table, right) were fit with a power-law function in order to estimate the flux within that layer at the measured field water content of 0.292. Flux within that layer is 12.5 cm/y. The flux calculated to include the matric potential gradient (in this case driving flow downward in addition to gravity) is about 16 cm/y. This is a rough calculation using an approximate gradient as the data are too far apart spatially to capture a detailed gradient. Recharge estimated from tritium data indicate a recharge rate of 7 cm/y for this site (McMahon and others, 2006).
| National Research Program | USGS | Water Resources | Unsaturated Zone Flow Project Home Page |