

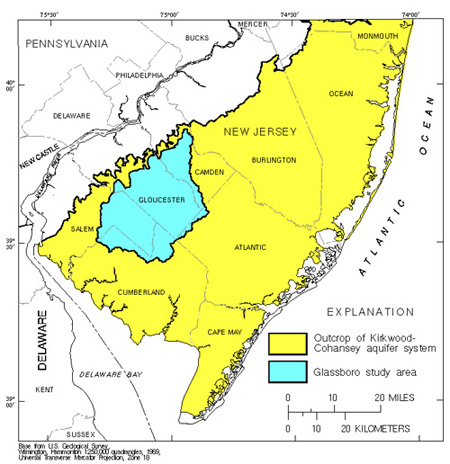
The Glassboro Study Area, comprising mixed urban and agricultural land in the coastal plain physiographic province of southern New Jersy, is an example case where the climate is humid and steadiness of flow is variable spatially and temporally. It is desirable to use a point recharge estimation technique in addition to the commonly-used water budget method in order to assess that variability. Some locations within the study area appear to have somewhat steady recharge and some have recharge that is more episodic in nature. Precipitation is distributed nearly even throughout the year, though evapotranspiration is greater in summer. The specific location within the Glassboro Study Area that is presented here illustrates estimation of recharge in a humid region that varies possibly seasonally, within limits. A study of the variability pattern within the entire study area is presented by Baehr and others (2002). Perkins (2005) evaluates the effect of using measured (with various interpolation techniques) vs. estimated hydraulic properties on calculated recharge rates for six locations within the study area.
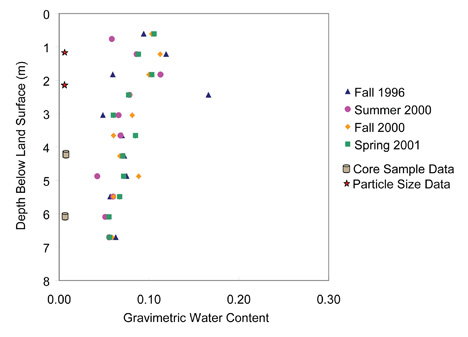
Field-water contents were determined gravimetrically at four times; fall 1996, summer 2000, fall 2000, and spring 2001 (graph at right). Field water contents appear to vary within a limited range below 5 m (depth to water is about 7.5 m). Minimally-disturbed core samples were also taken during fall of 1996 using a split-spoon sampler for laboratory measurement of unsaturated hydraulc conductivity within the zone of steady flow using the steady-state centrifuge method. Particle size distributions were also measured at four depths to assess heterogeneity.
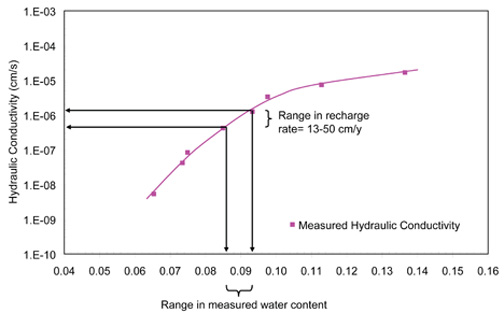
Soils within the study area are generally sand to sandy loam in texture with variable degrees of layering. The site examined here, which is one of six where unsaturated hydraulic properties were measured, fines upward texturally. This may influence the steadiness of flow at depth, whereas more uniform profiles may allow for water to recharge in more of a pulse-like manner (Perkins, 2005). Results based on the available field-water content data indicate that recharge rates vary between 13 and 50 cm/y (graph at left). Numerous water budget studies for the region indicate recharge rates of 33 to 49 cm/y.
This case demonstrates using the Darcian method as a way of establishing limits on recharge rates and does not indicate total recharge as data are too temporally sparse. These rates may only be considered as snapshots in time and give no indication of long-term averages. It is possible that extreme climatic events could yield recharge rates outside of the limits determined here.
| National Research Program | USGS | Water Resources | Unsaturated Zone Flow Project Home Page |