Using the MRC Program
MRCfit.v4.15.r: This program assists the user in estimating values of the parameters
needed to specify the master recession curve as required for the EMR program.
The basic MRC form used by these programs is a straight line representing the functional relationship between R and dR/dT.
Its two parameters are the slope and intercept of this line. As described in detail by Nimmo and Perkins (2018), a 2-part MRC (in the form of two joined line segments) is appropriate
in some cases. For example, when analyzing streamflow data periods of pure baseflow may have an MRC slope different from those of periods when stormflow in addition to baseflow is
occurring. Analogously, for water level data, recession behavior can be different where the water level fluctuates through different geologic layers of the medium. Within the code there
is a parameter that allows the user to set limits for the MRC fit. The MRC program has been written with a capability of handling MRCs represented by more than two linear parts, though
as of February 2019 this has not been tested with data. If a 2-part fit is chosen the program MRCplot can be used to see the combined fits.
Below is a screen shot of the MRCfit code on the R Studio interface. The # symbol indicates a comment in the program.
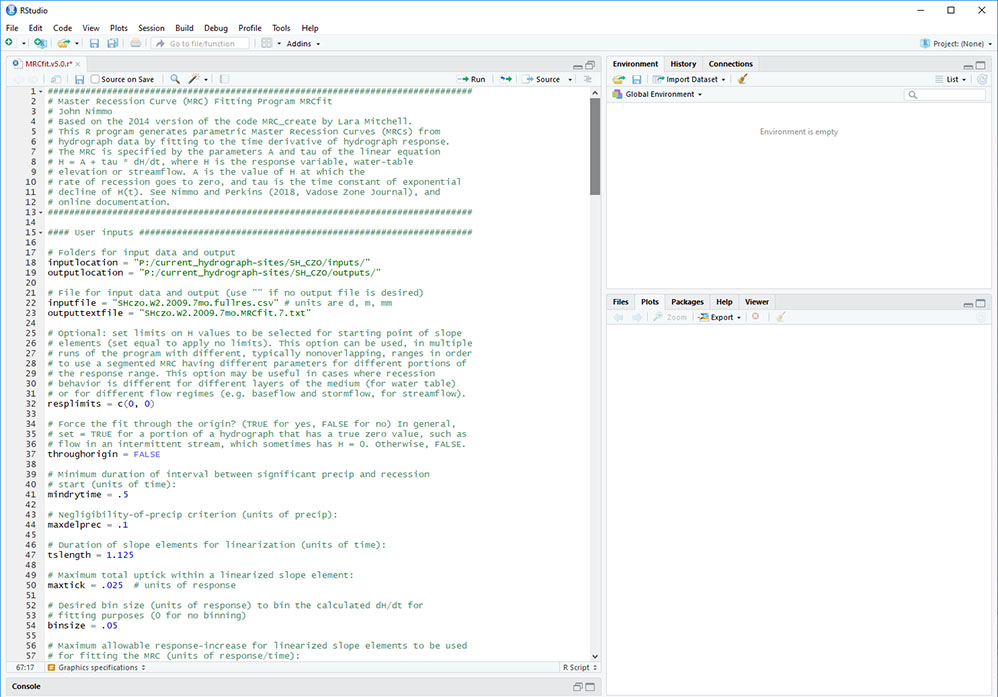
As explained by Nimmo and Perkins (2018), there are several user-adjustable parameters whose optimal values depend on site-specific
characteristics and require judgments based on hydrograph behavior in response to precipitation. It is good to start with a best guess and adjust parameters based on examination of the output
graphs. The following lines are those that are required input
- Line 18: path to inputfiles
- Line 19: path to output files
- Line 22: input file name
- Line 23: output file name
- Line 32: response limits (Min and maximum of R values that are acceptable as starting points of slope elements)
- Line 37: Force the fit through the origin?
- Line 41: the value is the minimum duration of interval between significant precipitation and the start of the interval of acceptable recession data
- Line 44: this is the minimum amount of precipitation that can be tolerated as negligible during an interval of acceptable recession data
- Line 47: this is the duration used in each linear fit slope element of recession, for instance for hourly data it might work well to linearize over a period of half a day, so that a line segment fit to 12 data points will be used as the slope
- Line 50: maximum allowable hydrograph-increase for linearized slope elements to be used. This allows for elimination of some high-amplitude (positive-slope) noise in the recession data. Setting to 0 eliminates recession intervals with upticks
- Line 54: desired bin sizes used for averaging of R vs. dR/Dt vs. E points before fitting the overall slope, Set equal to 0 for no bin-averaging
- Line 58: maximum allowable hydrograph slope to be used in fitting the MRC. For example, setting to 0 means that any upward-trending slope element will be ignored
- Line 63: X axis limits for response graphs
- Line 64: Y axis limits for response graphs
- Line 65: Y axis limits for precipitation graph
- Line 66: X axis limits for slope graphs
- Line 67: Y axis limits for slope graphs
Step by step instructions
- Open the RStudio Software
- Go to File -> Open -> MRCfit.v5.0.r file
- The downloaded program file is intended to be a template. It is recommended that the user change the file name after downloading, perhaps inserting (after the version number)
coded indications concerning the site, instrument number, time period, or other pertinent information.
- Insert proper information and best-guess parameter values on lines within the program, as described above
- Click on the "source" button to run the program (a shortcut useful for trial-and-error procedures is to check the Source on Save box)
- Examine graphs and other output to evaluate the suitability of results, and assess desirable parameter adjustments
- Revise parameters and iterate until the fitted MRC is satisfactory
Outputs
- Graph of the fit to the recession data with fit coefficients and input parameters
- Graph of hydrograph with recession periods highlighted that were used as slope elements in the MRC fitting
- Output file with fit coefficients required by the EMR program (.txt format) and tabular data used by the MRCplot program when a 2-part fit is desired.
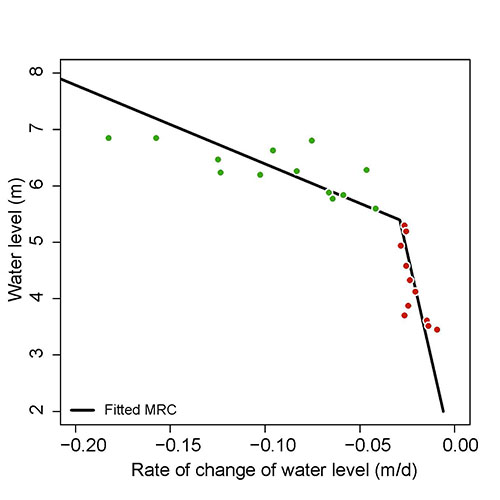
The graph below shows an example where a 2-part fit is appropriate. The MRCplot program used to generate this graph requires only pathnames
and file names. The files needed as input are the 2 output text files generated by running MRCfit for different response limits of the hydrograph data. Here, the limits
chosen for water level were 0 to 5.5 and 5.5 to 10.