
![]()
Required data are the hydrograph, normally water table elevation from a user-designated reference level, and cumulative system water input, typically precipitation.
For accurate EMR results, input data must be at equal time intervals, without gaps. The Time merge program is useful to match up and combine data files where time intervals differ. Time intervals for response (water level or discharge) must match
precipitation data so this program does an interpolation to match up time steps. There are 2 input files required: the master file which has the data with the desired time
interval, typically the hydrograph, and the interp file which contains the data to be interpolated, typically precipitation. It is often desirable to have the finer temporal
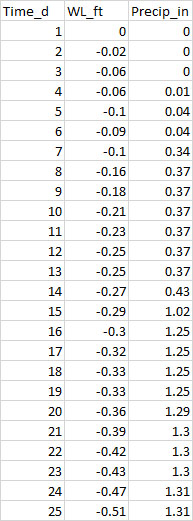
resolution data as the master file. The interp file may have gaps, which will be filled by linear interpolation. Format of input file: this comma delimited (.csv) file created by the user contains 3 columns of data. It can be
created in a spreadsheet and saved in comma-delimited format. The first column is time, referenced from t=0 at any starting time that is relevant to the data set as a whole
(usually at or before the earliest time in the data). Time must be specified on a continuous scale with consistent units such as h or d. Formats such as month/day/year must be
converted to a continuous, single-unit scale (which can be done with the Time merge program). The second column has the response variable of the hydrograph. It can be elevation
of the water table, given as height above sea level, or depth below land surface (in which case the numbers will be negative), or any other convenient reference level. For surface water it
can be streamflow in volume per time. The third column is cumulative precipitation from a chosen reference time. Response and precipitation can be in any desired units. Column headings must not contain spaces and should be chosen with care as their text will appear as axis labels on graphs.
The R programs interpret them as names of variables, which permit periods and underscores but prohibit most other punctuation.For example: Time_d, water_level_m, precip_mm. NOTE: Especially for time data, which the programs must recognize as equally spaced, there must be a sufficient number
of decimal places for the differences in time steps to be equal within a very small tolerance. This issue is important when preparing data files in commercial spreadsheet software,
which may drop decimal places in rounding. Required form of input data
![]()