
You are what you eat
Fingernail Results
How High on the Food Chain Are You?This can be determined by a simple lab measurement. During the 2003 Open House, we used two mass spectrometers in our labs to analyze a tiny clipping from our visitors' fingernails for carbon and nitrogen isotope ratios. These ratios are indicators of the relative importance of fruits, vegetables, grains, marine fish, meat, cane sugar, corn products, and dairy in your diet. The data will not tell you if your diet is good or bad. The isotope ratios simply reflect the influence of various types of food in your diet on your isotopic composition. To better understand this concept, take the bear, for example. During the salmon migration season when the bear eats primarily salmon, it is 1 step higher on the food chain than the salmon. In other seasons when the bear eats mainly berries, the bear is lower on the food chain than salmon. Isotope ratios can be used to trace seasonal and spatial differences in diet. This diagram below shows the full food chain for bears during salmon season when the bears are carnivorous, starting with algae at the base of the salmon food chain. If a human eats the bear, then he/she is eating at 1 step higher in the food chain than the bear. 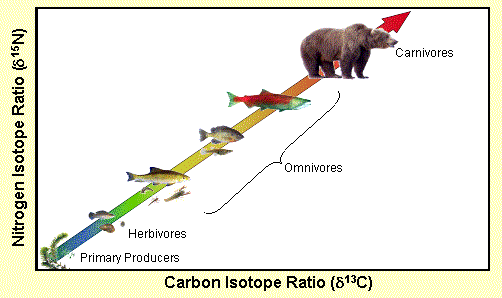
|
|
Please contact Carol Kendall ([email protected])
for questions and comments regarding this page.
This page was last changed in June 2003.
To the USGS Home Page
To the Water Resources Information Home
Page