Comparing results from 2006 and 2003
|
|
|
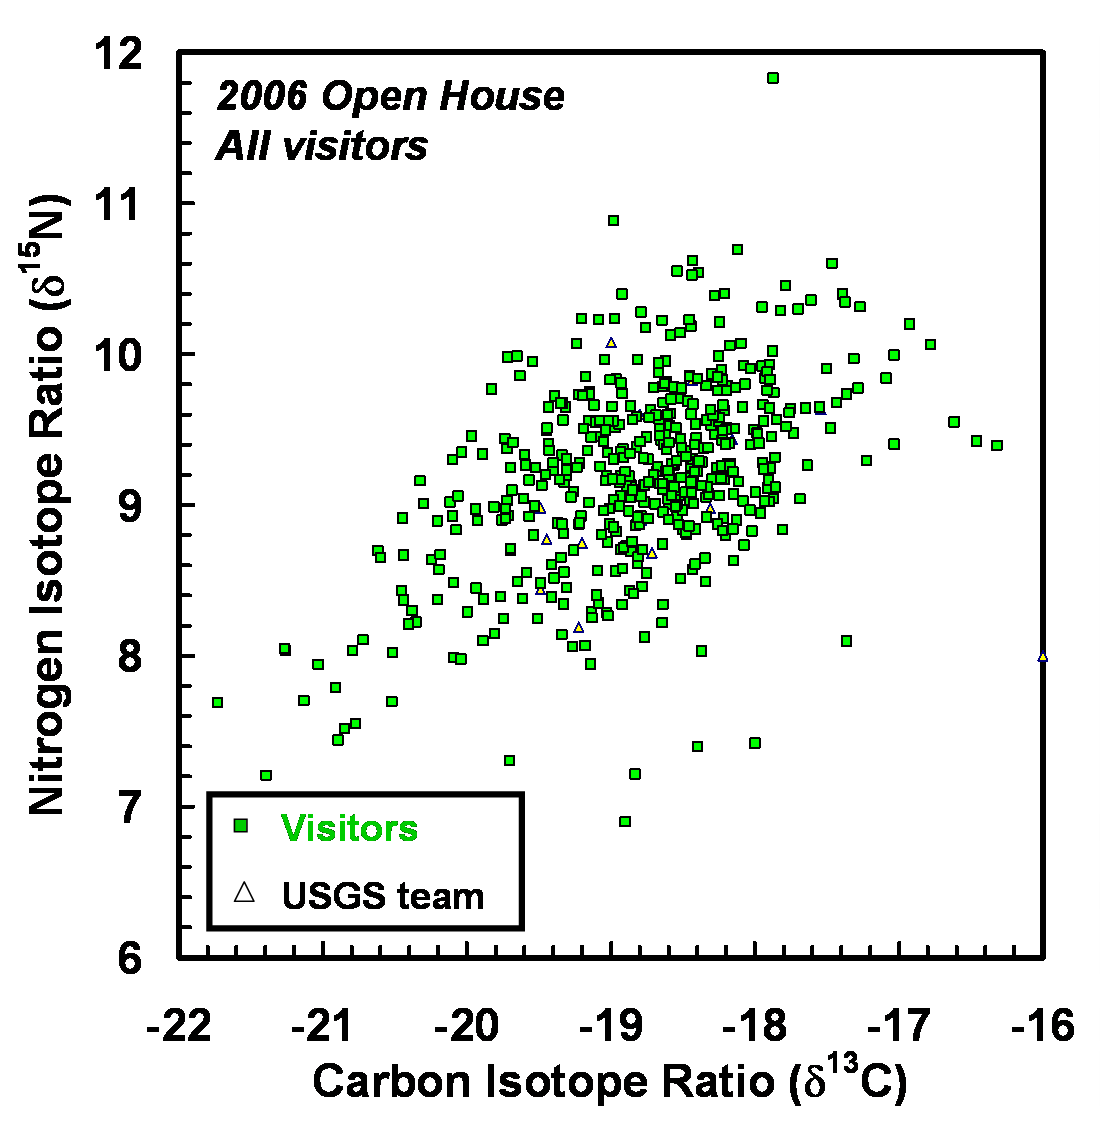
The figure above shows
the isotopic compositions of fingernails from visitors at the 2006 Open
House. The position of each point reflects the individual diet of the
visitor (e.g., the relative amounts of marine fish, meat, fruits &
vegetables, etc.).
View larger image.
|
|
|
|
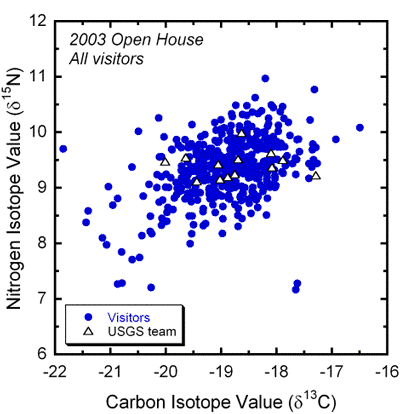
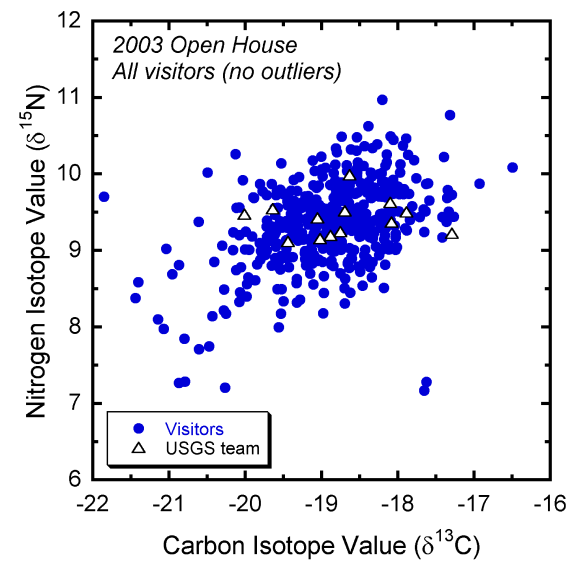
The figure above shows
the isotopic compositions of fingernails from visitors at the 2003 Open
House. The position of each point reflects the individual diet of the
visitor (e.g., the relative amounts of marine fish, meat, fruits &
vegetables, etc.). View larger image.
|
|
|
|
The chart
above shows the Nitrogen and Carbon isotopic compositions of typical
foods, and how different types of diet cause different isotopic
compositions of the consumer’s fingernails and hair (as shown by
the arrows below). Hence, by measuring the isotopic compositions of your
fingernails, we can see differences in the diets of visitors at the time
that the fingernails were formed. View
larger image.
|
|
|
