The wait is over
During
the 2006 Open House June 3 and June 4, we analyzed fingernails
of 501 visitors for carbon and nitrogen stable isotope ratios. This was
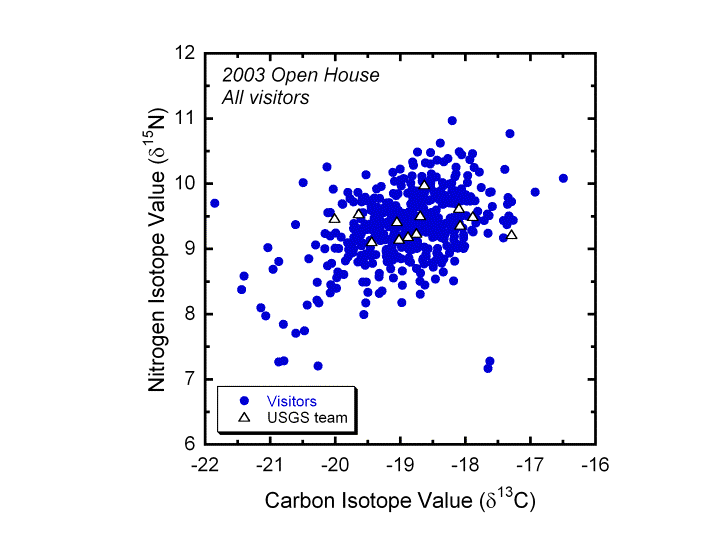
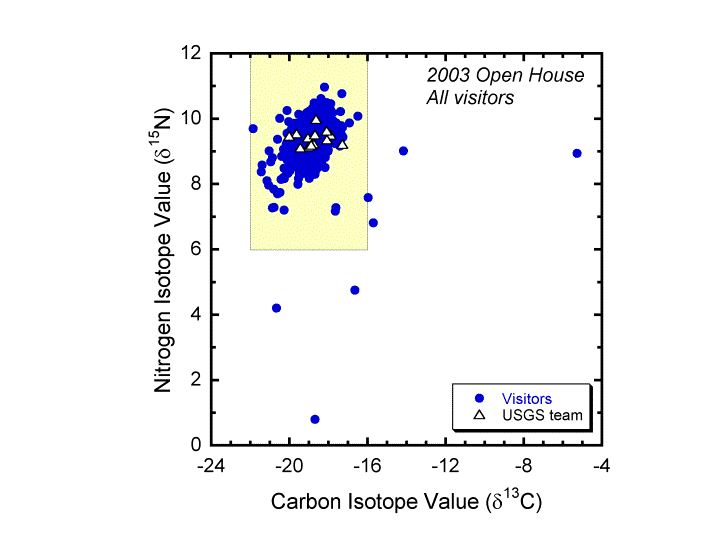
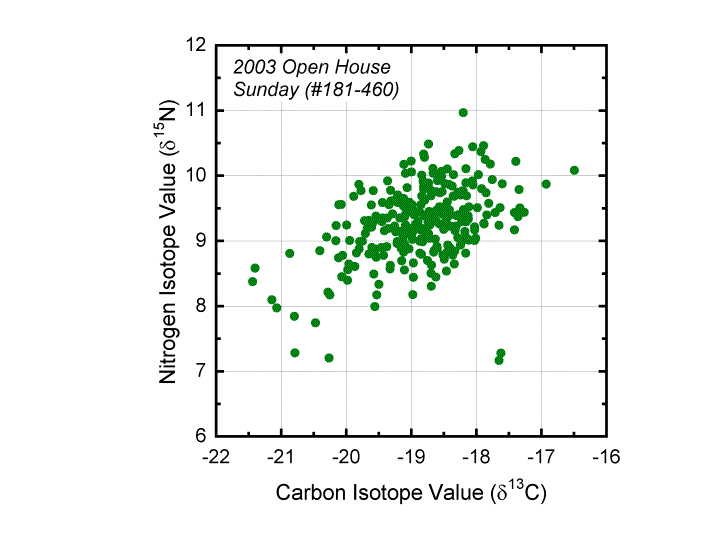
even more than in 2003 (456 fingernails) and 3 times more visitors than at
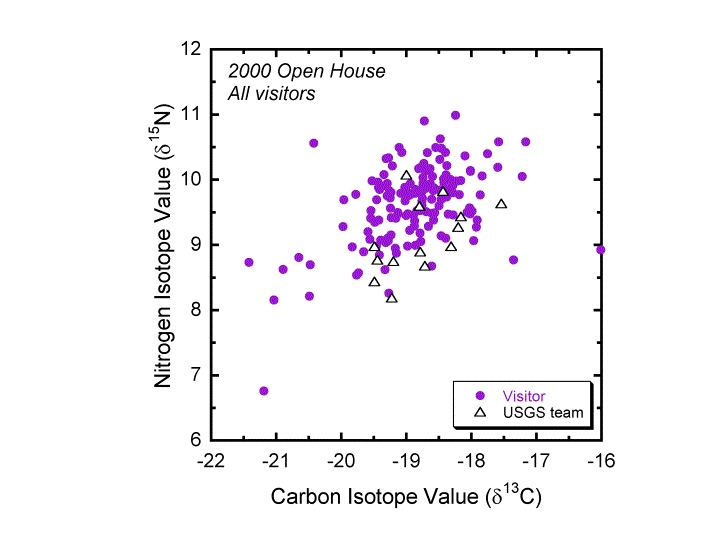
the 2000 Open House where we analyzed 150 fingernail samples. Hence, we
have been much slower in getting the samples analyzed and posted on this
web page than expected. Sorry about that!
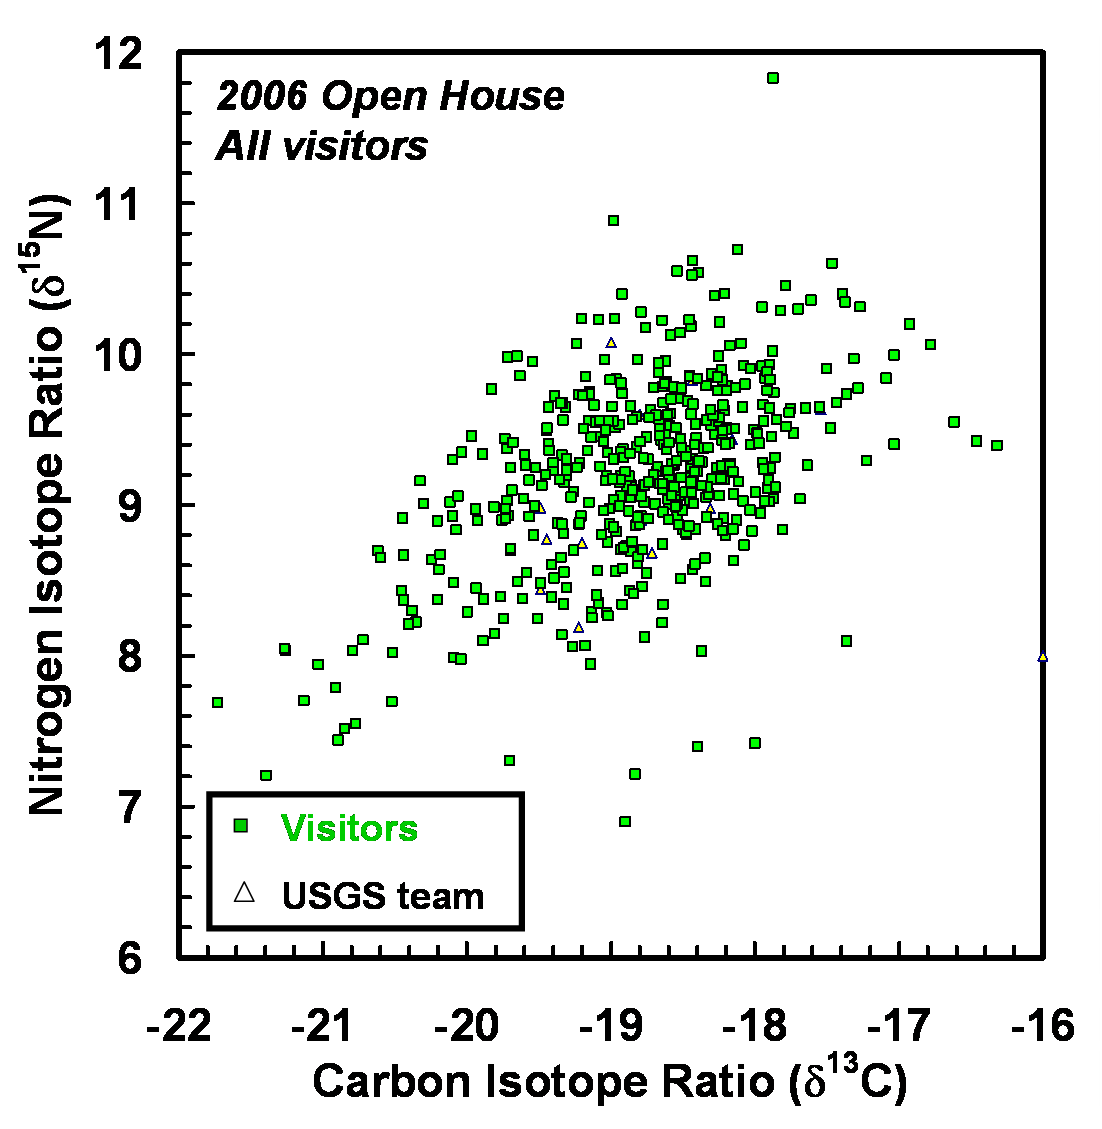
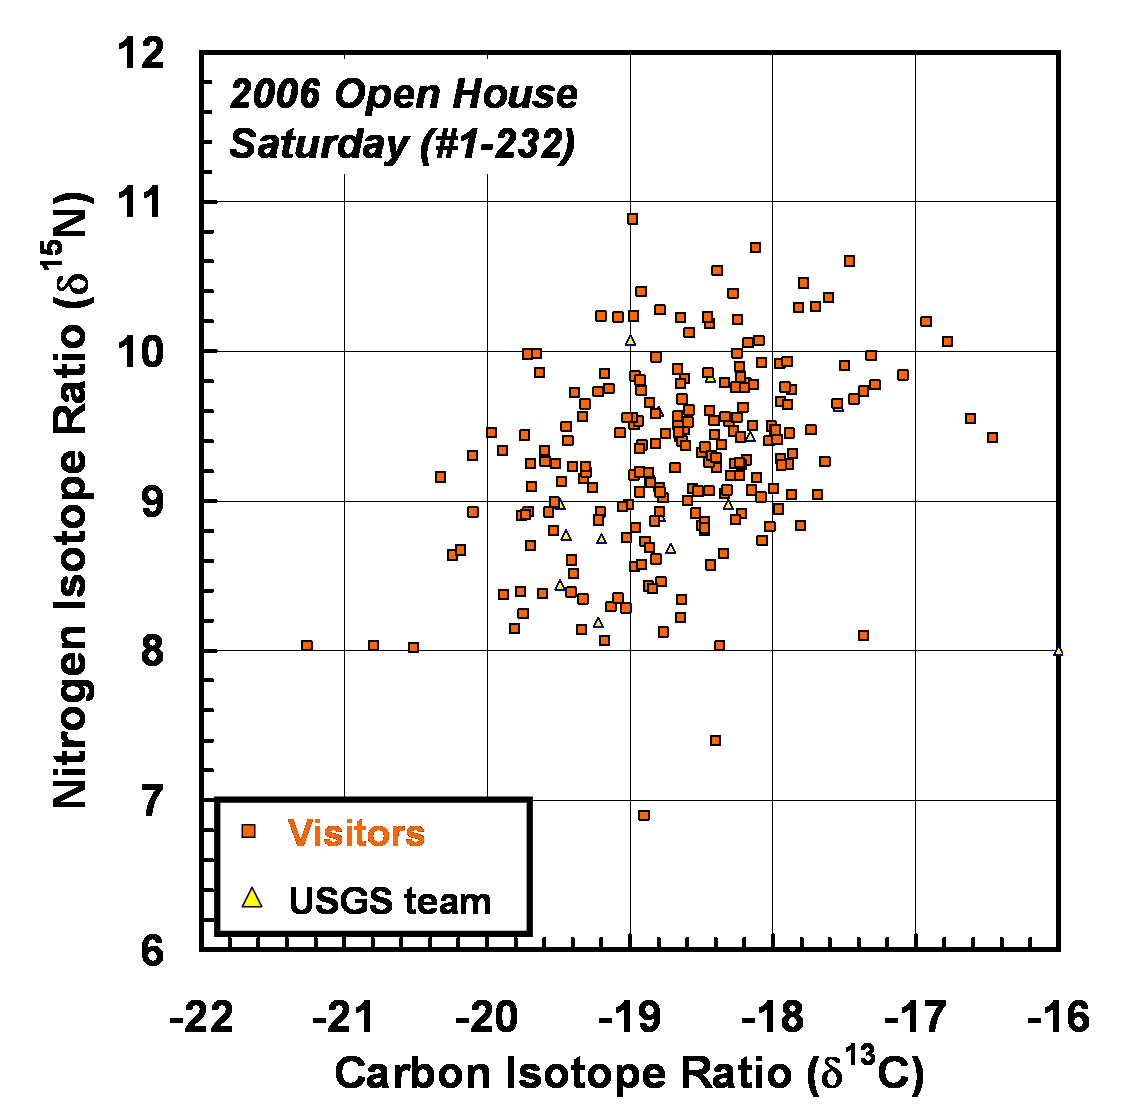
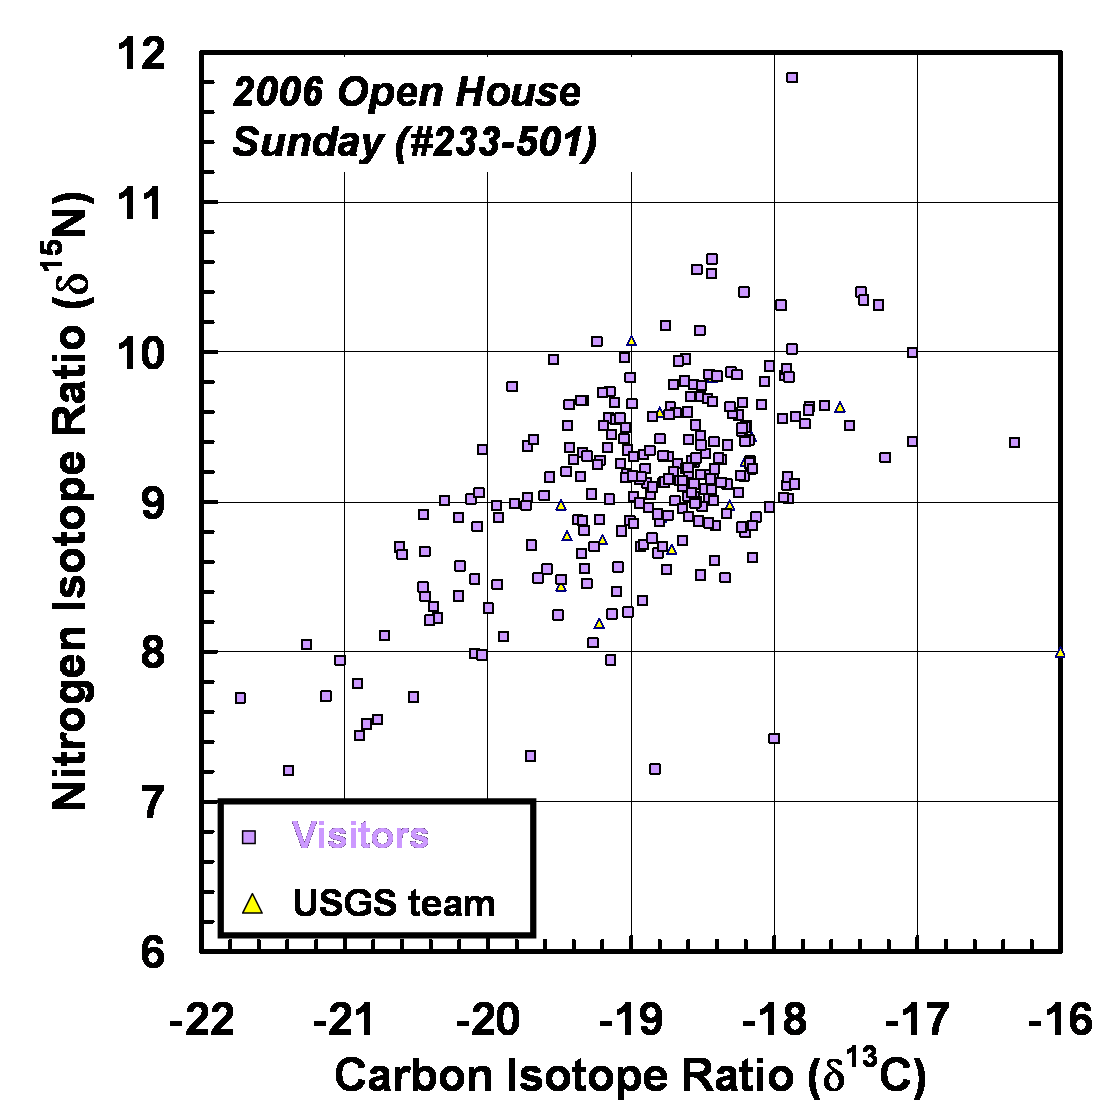
Below are several
plots containing the new fingernail data, a table of values linked to
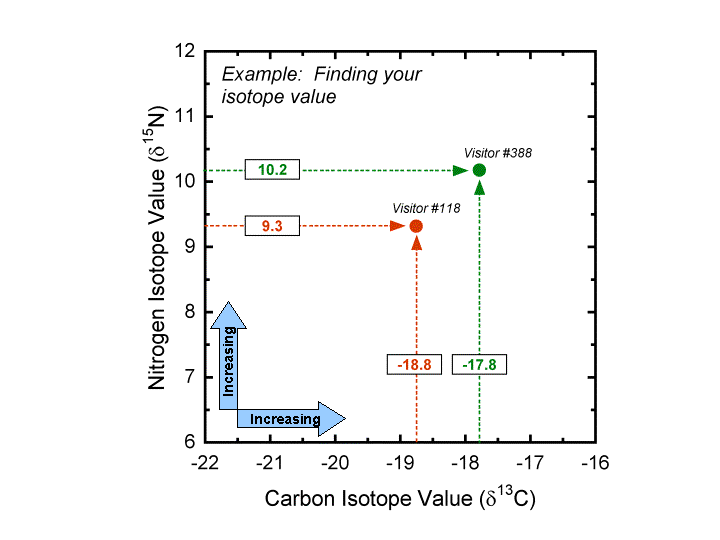
visitor fingernail number, and some preliminary text material that provides
a brief discussion of what the fingernail isotope values mean and how to
locate the position of your sample on the plots.
THE 2006 WEB PAGE UPDATES
ARE IN PROGRESS! CHECK BACK NEXT
WEEK FOR MORE PLOTS AND DISCUSSION.
Data for visitors to
the 2006 Open House:
Data for visitors to
the 2003 Open House:
Note:
The Carbon isotope ratio values (d13C)
and the Nitrogen isotope ratio values (d15N)
on the table and plots are slightly different than the preliminary values
given to visitors lucky enough to have their fingernails analyzed while
they waited. This is because the initial preliminary values had not been
corrected for various mass spectrometer parameters that shifted during the
day (and can only be corrected after the entire set of samples and standards
are analyzed).
Note: There were a few
fingernail samples that were lost during preparation or analysis, and we
did not have enough spare fingernail clippings to repeat the analyses. If
there are no values for your sample number, and you would like to try
again, send another (larger!) fingernail sample to the address below. If
you provide an email address (or a mail address) we will send you the new
data when available.
Fingernail samples
c/o Steve Silva
USGS -- MS 434
345 Middlefield Road
Menlo Park CA 94025
|
