Interpreting the Data: Isotope terminology
Let's quickly review
some basic isotope terminology, so you know how to compare your isotope
values to foods and other visitors on the graphs. When we analyze
a fingernail sample for isotope ratios, we are comparing the relative
amounts of a "heavier" isotope and a "lighter" isotope
in your fingernail to trace what you ate. These isotopes are
"stable", meaning that they are not radioactive. For carbon, the
heavy isotope is 13C and the light isotope is 12C.
For nitrogen, the heavy isotope is 15N and the light is 14N.
Did You Know?
|
|
The international reference
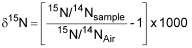
standard for nitrogen isotopes is nitrogen gas found in common air! The nitrogen
isotope composition of air changes very little from place to place and
over time.
The international
reference standard for carbon isotopes is VPDB, which is shorthand
for "Vienna Pee Dee Belemnite". The original PDB sample was a
sample of fossilized shells of an extinct organism called a belemnite
(something like a shelled squid) collected decades ago from the banks
of the Pee Dee River in South Carolina. The original sample was
used up long ago, but other reference standards were calibrated to that
original sample. We still report carbon isotope values relative to PDB
but now use the term “VPDB” to indicate that the data are
normalized to the values of that standard.
After learning
that nitrogen in air is used as the nitrogen isotope reference
standard, you might ask why we couldn't simply use the carbon isotope
composition of air (CO2 gas) as the standard for carbon
isotopes, instead of using fossil shells. Good question! The short
answer is that a reference standard needs to have a constant value,
because all analyzed samples are compared to it to calculate the d13C value. Because the d13C value of atmospheric CO2
changes significantly over time and space, different laboratories (and
analyses at different times) would give very different d13C values for your fingernail
if that were the standard! The early isotope pioneers understood this
and wisely selected VPDB as the standard.
|
|
When isotope
biogeochemists (like us USGS folks) analyze samples for isotope
composition, we report the results in a special notation, called
"delta notation", that has a similiar format for carbon
and nitrogen
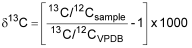
isotopes. The carbon isotope ratio values, (written as d13C and pronounced "delta
see thirteen") and nitrogen isotope ratio values (written as d15N and pronounced "delta en
fifteen"), that we determined by analyzing your fingernail sample, are
simply a way of comparing the isotope composition of a sample with that of
an international reference material (called a "standard").
Specifically, we
compare the ratio of the heavier to lighter isotope in the sample with the
same ratio in the standard. Your body parts and most living things have a
smaller ratio of 13C to 12C isotopes than the
carbon standard (i.e., relatively less 13C), so the d13C values are negative. For
example, plants like wheat have d13C
values that average about -27‰ (pronounced "minus twenty seven
per mil", and meaning -27 parts-per-thousand). In contrast, animals
typically have a higher ratio of 15N to 14N isotopes
than the nitrogen standard (i.e., relatively more 15N), so the d15N values are positive.
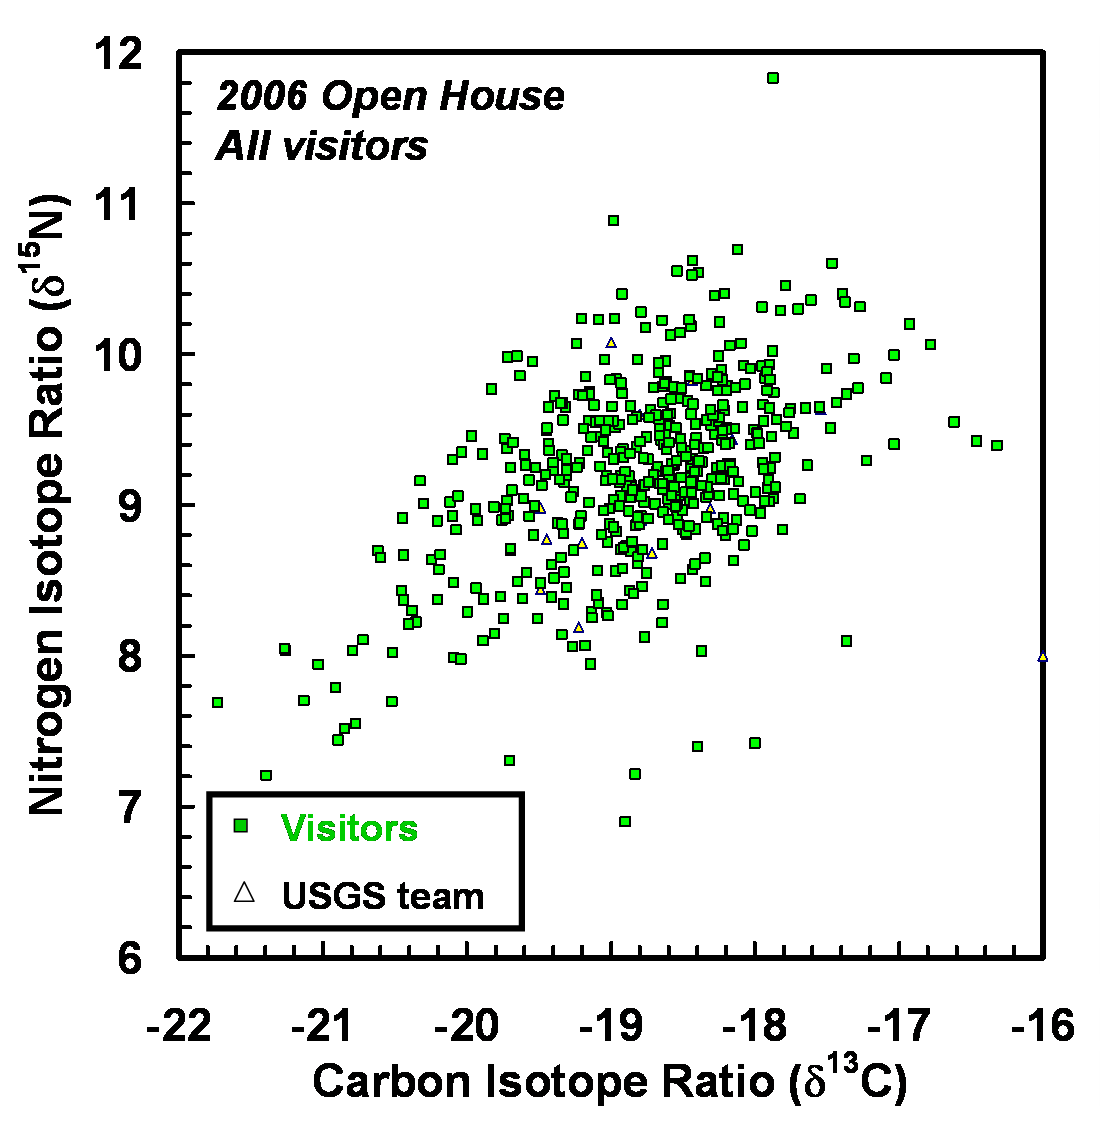
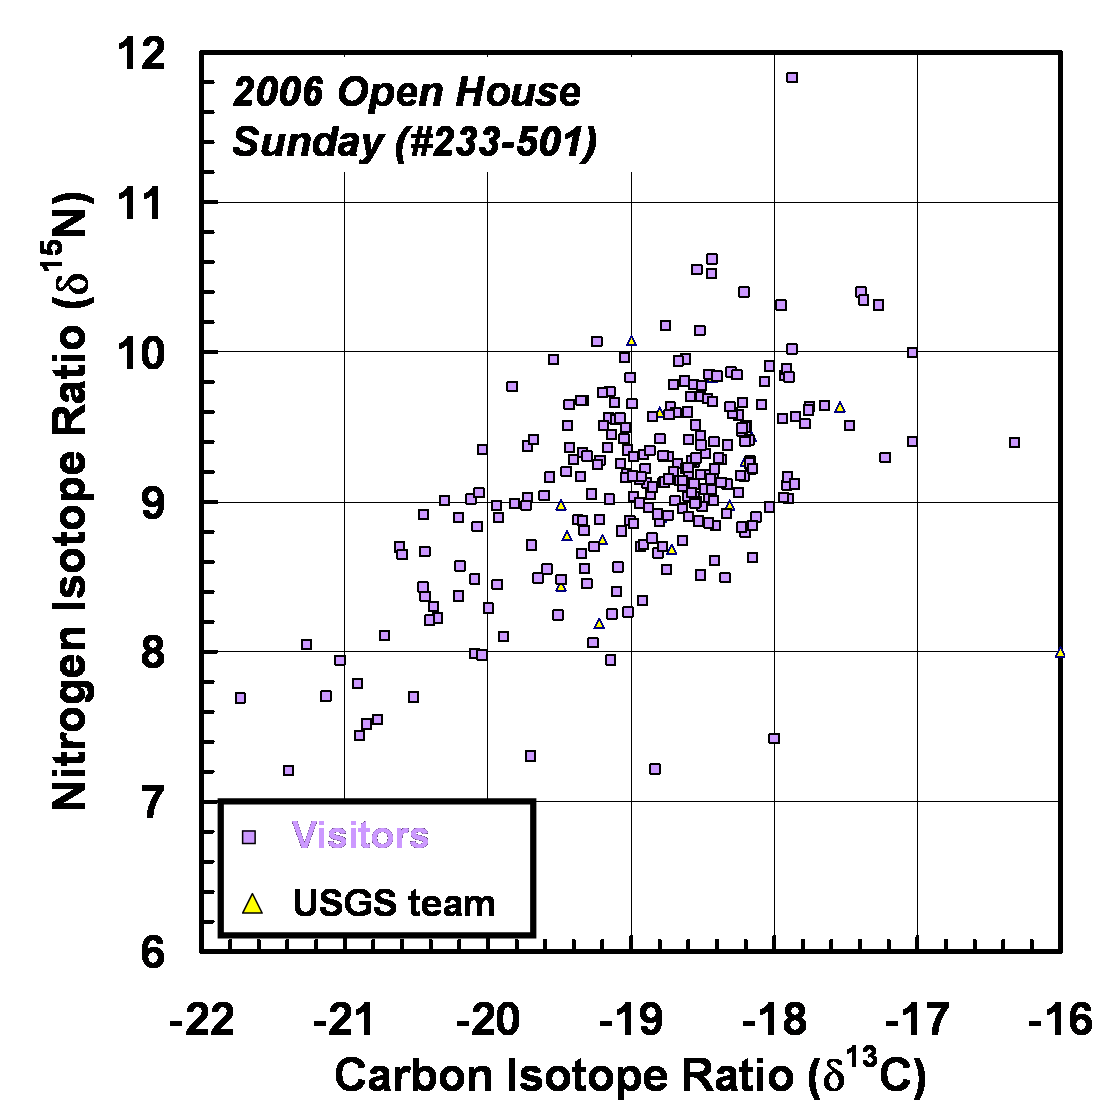
Finding your 2006 isotope value on the graphs
To find where your
fingernail isotope values for 2006 plot relative to foods and other Open
House visitors on the graph, first go to
the data table and find the number you
were assigned when you gave your fingernail sample. Write down the d13C and d15N values for your number from
the table. Recall that these values have units of "per mil"
(symbolized by "‰"), which is parts per thousand difference
from the isotope ratio of the reference standard. You can locate your value
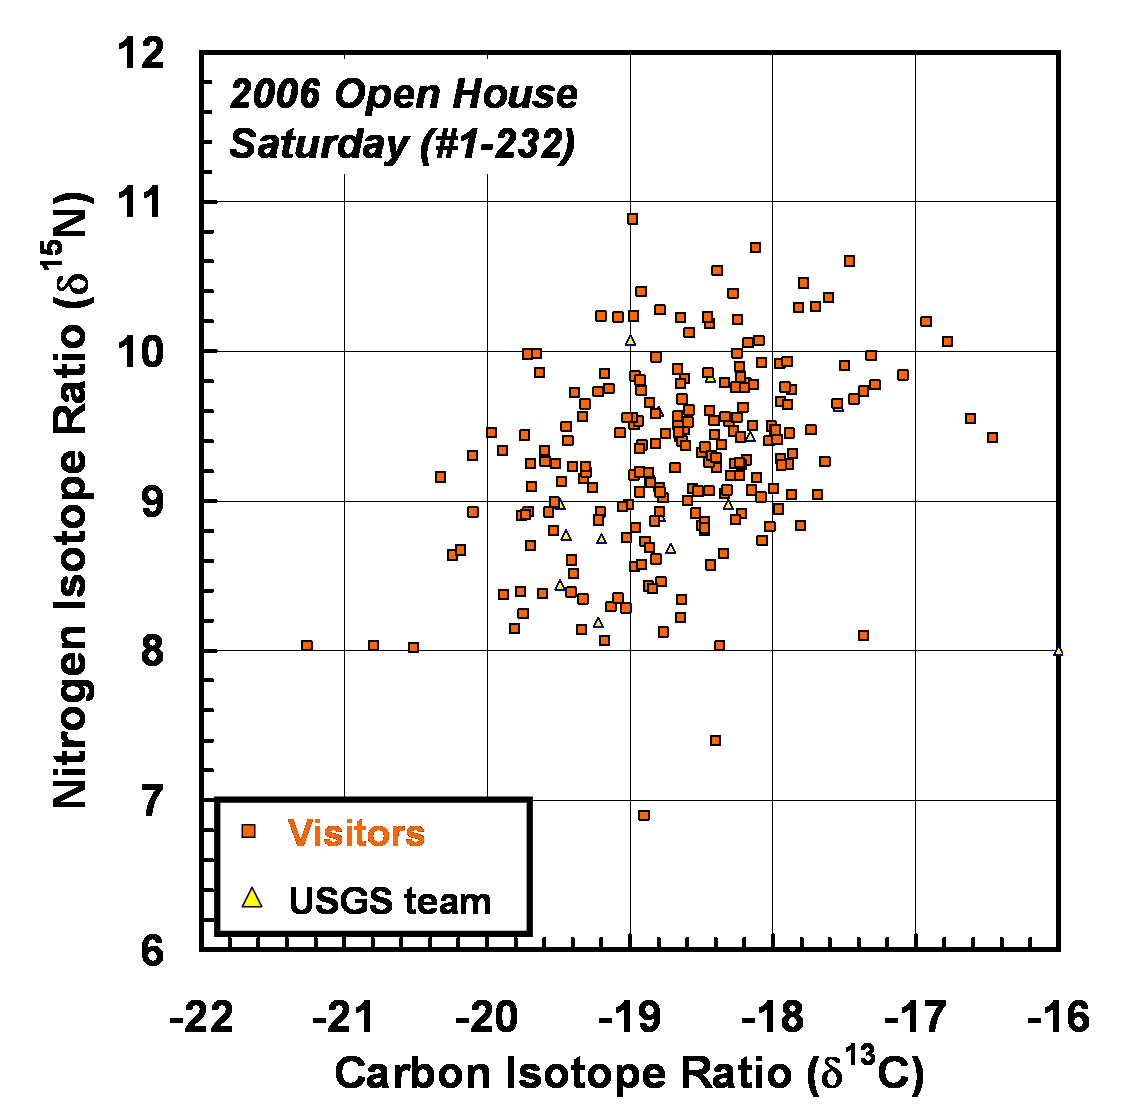
on either the plot of all the 2006 data, or
on separate plots for Saturday visitors and
Sunday visitors.
Next, locate your d13C value on the d13C scale (bottom axis) of the
chosen graph and draw a vertical line up from that point, across the graph.
It may help to print out the graph first. Then locate your d15N value on the d15N scale (left axis) of the
graph and draw a horizontal line across the graph at that point. The place
where your lines cross is where your fingernail plots.
Finding your isotope values
Let's say I was
visitor number 118 during the Open House in 2003 (see
example). I find 118 in the left column of the data table and write
down my isotope values listed to the right: d13C = -18.8 and d15N
= 9.3. Next, I go to the graph and locate -18.8 on the d13C scale (bottom axis). It may
seem odd at first to deal with negative numbers like this. But the
important thing to remember is this: the larger the number after the
negative sign, the farther left you'll move to find it. Therefore, I know
that -18.8 is between -19 and -18, but closer to -19.
Starting at the -18
mark, I imagine ten equally-spaced divisions between -18 and -19 on the
graph scale and move left, counting off 8 (for the 0.8, or 8 tenths of a
unit on the scale). The mark halfway between -19 and -18 (i.e., -18.5)
should provide additional help with locating values. As an analogy to help
with the graph, you might think of the isotope values as money: so find
$18.80 between the $18.00 and $19.00 marks on the graph, using the $18.50
mark to help. When I locate -18.8, I draw a line straight up across the
graph.
Next, I find my d15N value of 9.3 (or $9.30) on
the d15N scale (left axis) in the same
way. This one is a bit easier, because the numbers aren't negative.When I
locate 9.3, I draw a horizontal line to the right across the graph. My
fingernail plots where this line and the vertical line drawn for the d13C value cross.
What does it mean?
The carbon and
nitrogen isotope compositions of various
types of diets are known and can be compared to the compositions of
your fingernails. Hence, the graphs of your
fingernail d15N and d13C values can help to identify
your diet. In general, if you eat more fruits, vegetables, grains, and meat
fed with these foods (like beef), your fingernail will plot farther to the
left. In contrast, eating more corn, sugar, and corn-fed meat will result
in fingernails that plot farther to the right. People who eat more animal
protein, and especially marine fish, will plot higher up on the graph, whereas
those who eat less meat will plot lower down. Keep in mind that, on
average, your isotope values are 1 unit higher in C isotopes and 3 units
higher in N isotopes than your average diet (see food
web diagram).
|
|
