

Evidence from field (e.g. Nixon and Lawless, 1960) and theoretical analyses (Gardner, 1964) indicate that water content fluctuations typically damp out below a depth of a few meters. In some cases, however, fluctuations have been detected at depths of tens of meters (e.g. Jones, 1978). In order to establish confidence that flow is steady, matric potential or water content should be measured for a period of a year or more, though this is often impractical. Often the distribution of water or uniformity of matric potential with depth at one point in time is used as an indication of depth to steadiness. If subsurface properties can be adequately represented, computer simulations using a variable saturation flow model, such as VS2DT, may be used with known boundary conditions to evaluate steadiness of flow at depth.

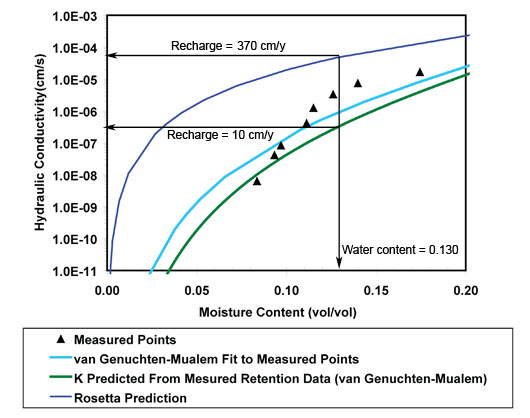
Because unstaurated hydraulic conductivity is costly and time consuming to measure it is often estimated based on more easily measured properties such as the water retention characteristic curve or textural information (graph right). For example, measured water retention data can be fit with the empirical formula of van Genuchten (1980), the parameters from which which combine easily with the pore-size-distribution model of Mualem (1976) to yield K(q ). Leij and others (1997) investigated the use of numerous closed-form expressions for quantifying the unsaturated hydraulic properties of soils and concluded that the functions by Brooks and Corey (1964) and Mualem (1976) performed reaonably well in describing the K(q) relationship. Pedotransfer function models are attractive as they often require as little as textural class percentages as input. The Rosetta model (U.S. Department of Agriculture, 2001) uses soil properties such as sediment texture and bulk density with neural-network analysis to estimate values of the parameters in the van Genuchten and Mualem equations by comparison with a database of measured hydraulic and textural properties for a large number of soils. Results can be variable as many of the soils in the database are agricultural, near-surface, or repacked. In very basic terms, the program, by way of network analysis, searches out the best hydraulic-data match given the input data. The Rosetta program is described in detail by Schaap and Leij (1998), Schaap and others (1998), and Schaap and others (1999). The graph (right) shows the large range in recharge rate estimates (10-370 cm/y) that are possible based on a field water content of 0.130 for for the various curves.
One reason steadiness of flow is important is that for the estimated recharge rate to represent a long-term average, the sampling must be done from a depth interval where flow is steady. This issue must be dealt with in any imperfectly steady Darcian evaluation of recharge. Without the physical averaging that in effect occurs as temporal fluctuations gradually blend together with downward movement through the upper portions of the unsaturated zone, a Darcian recharge estimate must be considered as applying at an instant or over a finite period of time.
Another major reason steadiness is important is that in a homogenous medium it implies that matric potential gradients are negligible and therefore do not have to be measured. In cases where the potential gradient is not negligible but it can be established that its magnitude remains small, it is possible to calculate a Darcian estimate for an average driving force (see Imperial case study). The uncertainty of such an estimate will be relatively large, though perhaps still acceptable, based on whatever limits can be established for the fluctuations of the magnitude of the gradient. In other cases, a flux may be calculated that applies for a finite period of time. As demonstrated in the New Jersey case study, it may be useful to establish limits on recharge rates, especially if variation is limited. In the most general case, where all unsaturated flow must be considered transient, one possibility is to apply the nonsteady Darcian method, for example in the study of Healy (1989). This more general method requires considerable in situ instrumentation monitored over a period of time to obtain the data needed to estimate time-varying recharge fluxes. This method normally requires more time and effort but can give detailed information, including a long-term average if carried out for a representative period of time.

The determined recharge rate must be sufficiently accurate for the intended application. There are errors associated with 1) measurement of field water content, 2) measurement of matric potential profiles, 3) deviations from the ideal of the matric potential and steadiness of flow, and 4) measurement or estimation of hydraulic conductivity.
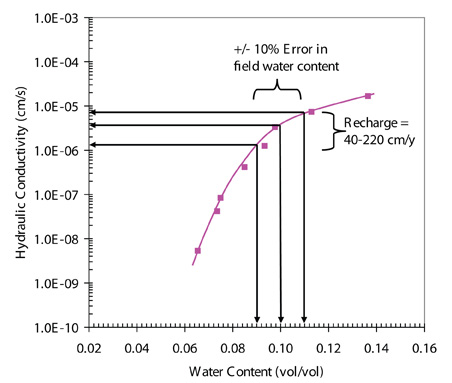
Error in gravimetrically-determined water content can be up to 3% under ideal conditions ( Gardner, 1986). Soils with significant organic matter (>5%) may lose mass due to oxidation and volatilization of organic components (Topp and Ferré, 2002), although samples taken from the zone of steady flow may be below the depth of significant organic matter accumulation. Potentially the most significant error stems from the sample collection process where evaporation can be significant, resulting in an underestimated recharge rate. The graph (left) shows the range of recharge rates (40-220 cm/y) associated with an error of ± 10% in field water content.
The main concern with error in matric potential profile measurement is uncertainty in steadiness (see Mojave case study). For example, a matric potential profile constructed from field-measured water contents (which also contain error) and a lab-measured retention curve may varied markedly from one that is measured directly with a tensiometer in the field. Also, all instruments have inherent measurement uncertainty, for example heat dissipation probes can have as much as ± 100 cm error.
Error in measured K stems from failure to reach steady flow conditions in the laboratory and direct measurement error associated with determination of inflow rates, driving force, and water content. These errors compound mostly in a non-linear manner into uncertainty in recharge rate. With attention to accuracy in field water content and K measurements, and verification of the steadiness of flow, confidence can be established that the estimates are well within a factor of 2 of true recharge rate. Error in recharge rate due to estimation rather than direct measurement of K is highly variable and can be quite significant as demonstrated in the graph above (right).
| National Research Program | USGS | Water Resources | Unsaturated Zone Flow Project Home Page |