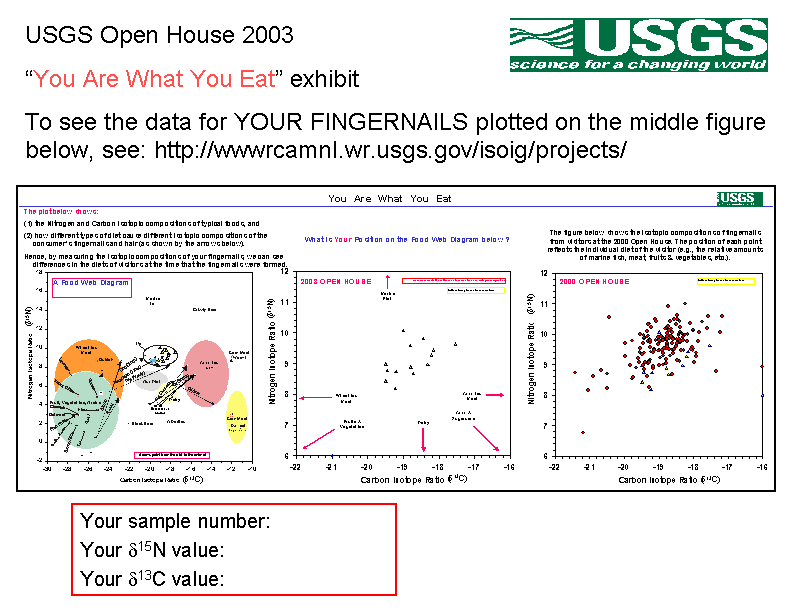
Food web isotope study using fingernails
During the 2000, 2003, and 2006 Open
House exhibitions at the USGS office in Menlo Park (California, USA),
team members of the Isotope Tracers Project analyzed fingernails of
visitors for carbon and nitrogen stable isotope ratios in "real
time", using two mass spectrometers.
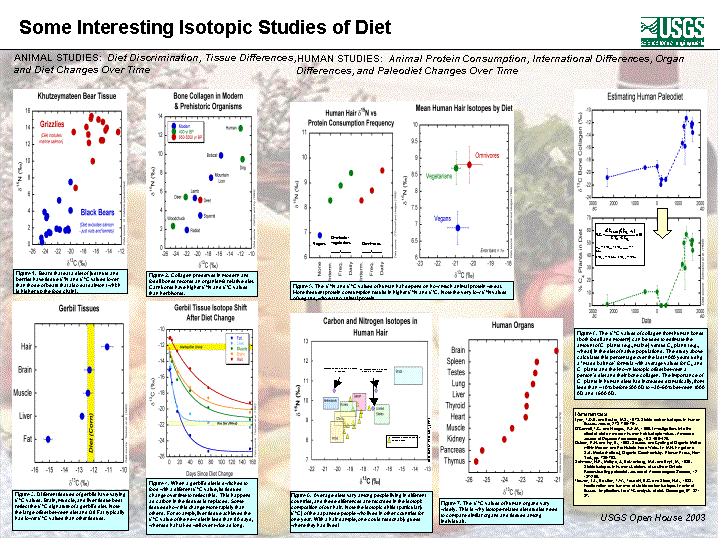
The purpose
of this exhibit was to demonstrate the usefulness of isotope
techniques for determining differences in diets between individuals. It
was also a lot of fun for both team members and visitors. This technique is
often used for isotopic studies of food
webs -- which is a method for determining who is eating what.
This kind of information can be very useful for understanding how toxic
materials, including mercury, become bioaccumulated
in animals high on the food
chain.
In 2000, we had 150
visitors over the weekend who contributed fingernail samples. In
2003, we had 3 times more visitors than expected -- 456. In 2006, we
had even more visitors – 501.
Since the number of visitors exceeded the number of samples we could
analyze during the weekend, the samples took a few additional days to
analyze, and the results were eventually posted here for the visitors to
see.
This web page provides
links to the results, including plots of fingernail data, explanations of
how to interpret the results, and examples of other applications of
isotopes for food web studies.
The posters and
handouts prepared for the 2003 Open House are available below. Many
of the posters prepared for the 2006 Open House are the same as for
2003. The new ones will be posted by
mid June.
Introductory
poster (High
Res PDF, 3.8m)
Poster
with the isotope data for fingernails of visitors (High
Res PDF, 86K)
Simple
explanation of stable isotopes (High
Res PDF, 315K)
More
detailed explanation of food webs and samples (High
Res PDF, 3.2m)
Examples
of other stable isotopes diet studies (High
Res PDF, 1.1m)
Handout from Open house 2003 (front
side, High
Res PDF, 157K and back
side, High
Res PDF, 181K)
|
|
